
With all the recent talk around the One Big Beautiful Bill Act, I wanted to take a second to talk about where our tax dollars go.
Understanding this can help put our nation’s bigger economic picture into perspective. The chart below offers a breakdown of how our federal government allocates its spending.
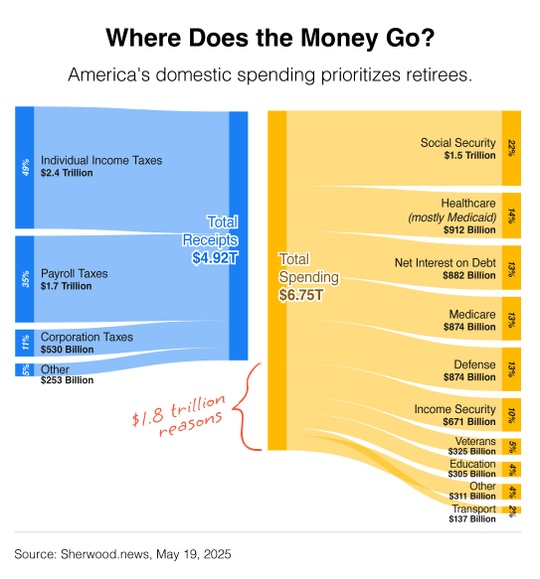
A $1.83 trillion deficit in fiscal year 2024 shows us spending $6.75 trillion, and collecting $4.92 trillion in revenue. The largest single expenditure? Social Security at $1.5 trillion. (1)
Social Security alone accounts for nearly a quarter of all federal spending. Social Security supports over 67 million Americans, primarily retirees but also survivors and individuals with disabilities. Healthcare programs like Medicare and Medicaid added another $1.8 trillion in expenses combined, underscoring just how much of our tax dollars go towards supporting Americans as they age.
Something I learned while writing this: In 1935 when Social Security was founded, the Full Retirement Age was 65. Back then, they didn’t allow you to file any sooner either. Also in 1935, the average life expectancy was 59 years for men and 62 for women! (Believe it or not, women today are outliving men by an even greater margin.)
By 1945, there were a total of 1.1 million beneficiaries on Social Security. This meant that for every one person collecting benefits, there were 42 workers paying into the system. By 2023, the year covered by the most recent trustees’ report, there were just 2.7 workers per beneficiary. (2) (3)
Social Security and Medicare are considered mandatory spending—meaning they’re not subject to annual budget negotiations. Defense spending ($874 billion) and interest on our debt ($882 billion) are also relatively stable. The areas subject to annual budget negotiations tend to be discretionary programs such as education, transportation, and smaller line items.
The federal budget reflects competing priorities: supporting retirees and vulnerable populations on one hand, while maintaining national security and essential services on the other. The challenge lies in balancing these needs with fiscal sustainability.
As inflation drives costs higher, higher interest rates also increase the annual interest expense we must pay on our national debt. In other words, this pattern is likely to continue for some time.
But, this isn’t anything new! In fact, since 2001 the U.S. has run at a deficit every single year. For now, these are just some of the challenges that lawmakers are working to address before they become bigger issues down the road.
Sources:
(1) Bipartisan Policy Center. (n.d.). Deficit tracker. Bipartisan Policy Center.
(3) Pew Research Center. (2025, May 20). What the data says about Social Security.


