
I'd like to share a few of my favorite charts that help illustrate how to think about risk in your portfolio and how it aligns with your personal risk tolerance.
If you’ve been following the news, you may be wondering—what just happened to the stock market? Not long ago, we were riding a bull market that felt like it had no end in sight. And then, things shifted—quickly.
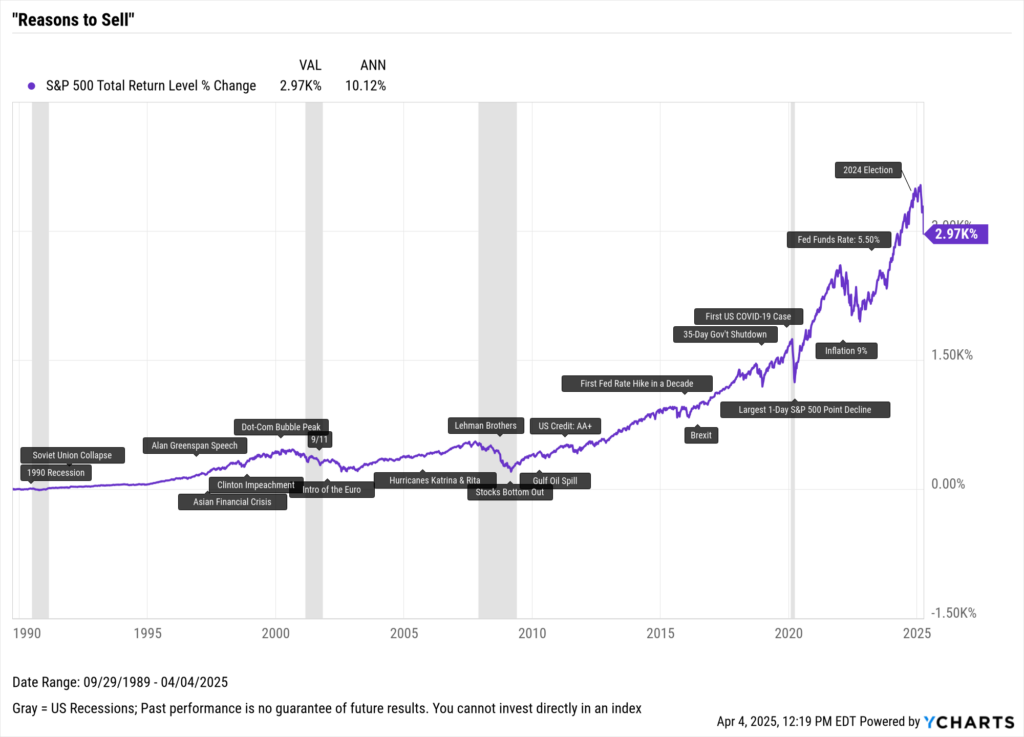
As your advisor, I want to offer some perspective. Market turbulence, while uncomfortable, is a natural part of investing. Every pullback happens for different reasons, and each one can feel like a crisis in the moment. But if we zoom out, history shows that markets have consistently recovered and moved forward.
Pullbacks Are Normal
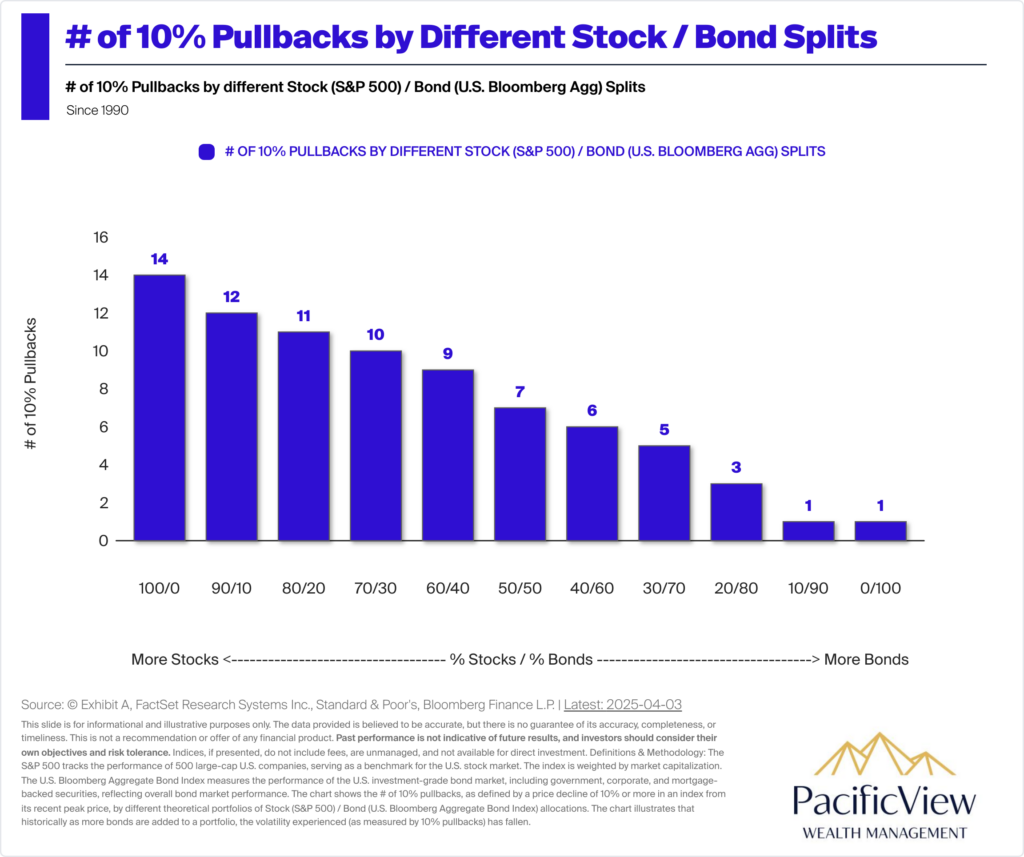
- Pullbacks Are Part of Market Cycles: Market pullbacks of 10% or more are a natural feature of both equity and bond markets. These declines, often driven by changes in economic conditions, investor sentiment, or other factors, are temporary and do not signal the end of market growth. Understanding that pullbacks are part of the market cycle helps investors stay calm and focused on their long-term investment objectives.
- A Look at the Data: The chart below shows the number of 10% pullbacks across various stock/bond allocations. For example, portfolios with a higher allocation to stocks (e.g., 80% S&P 500, 20% Bloomberg U.S. Agg Bond) have experienced more frequent 10% pullbacks compared to portfolios with a more balanced or bond-heavy mix. The data highlights the trade-off between risk and reward across different portfolio strategies.
- Investment Implications: The key takeaway is that more aggressive stock allocations typically result in more frequent pullbacks, but historically they have also delivered higher long-term returns. Investors should assess their risk tolerance and investment horizon to determine an appropriate stock/bond mix for their portfolio. While pullbacks may be unsettling, they also present opportunities for disciplined investors to buy at lower prices. Maintaining a diversified approach can help smooth out the impact of these pullbacks over time.
2025 Year-to-Date Performance Snapshot
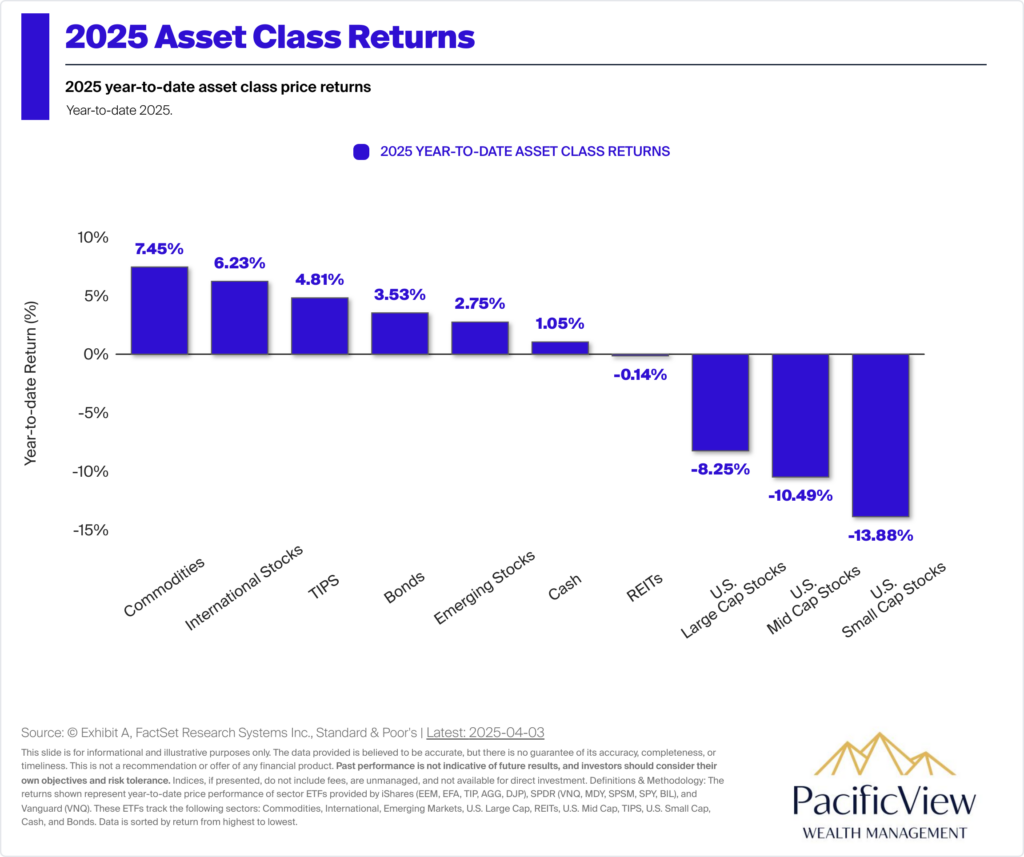
- Understanding Asset Class Performance: The next chart illustrates the year-to-date price returns of various asset classes in 2025, providing a snapshot of how different investments have performed year to date so far. It’s important for investors to assess how their portfolios have been impacted by the performance of equities, bonds, and other asset classes, especially within the context of broader market conditions.
- A Recent Look at the Data: The year-to-date price returns of asset classes in 2025 are displayed, showing how different categories such as stocks, bonds, and commodities have performed.
- Investment Implications: The data presented can help investors understand how their portfolios align with the performance of different asset classes in the current year. It is essential to remember that short-term performance should not drive long-term investment decisions. Maintaining a diversified portfolio aligned with long-term goals, regardless of short-term market movements, remains key to managing risk and achieving financial objectives.
The Cost of Sitting on the Sidelines
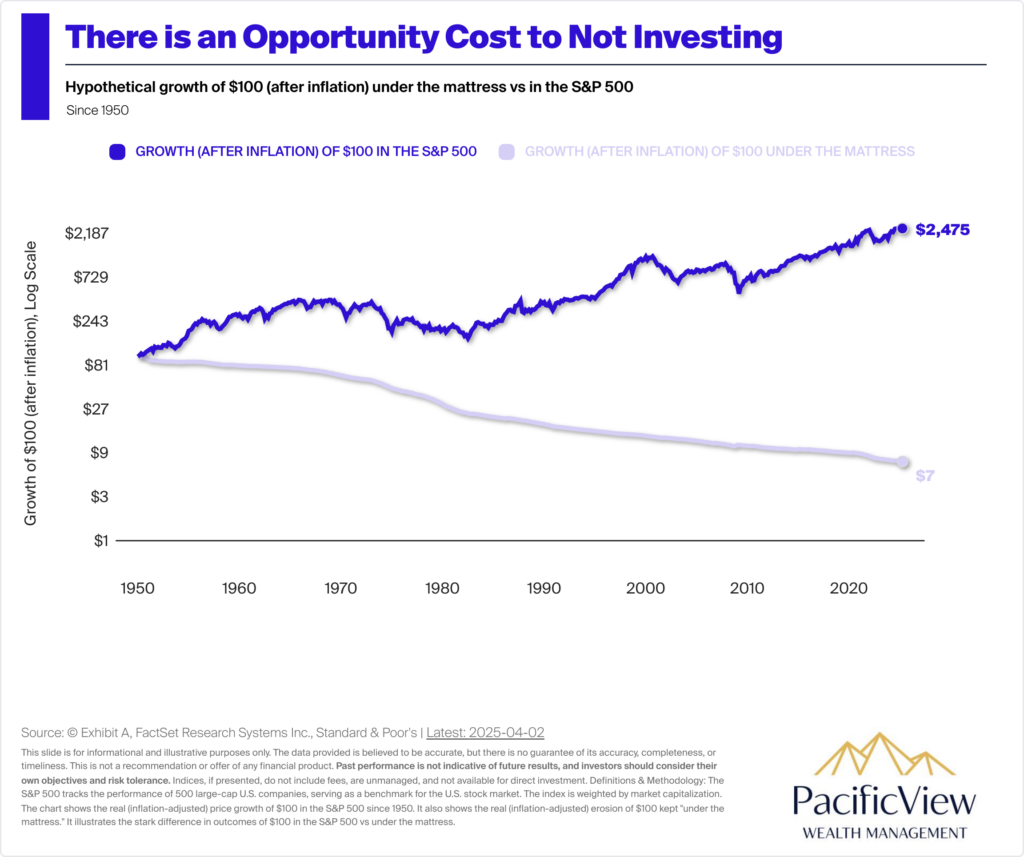
- There is an Opportunity Cost to Not Investing: Investing may seem risky, but the real risk is not investing. Since 1950, the S&P 500 has historically provided returns well above the rate of inflation, while cash earning no interest has been subject to inflationary erosion. This suggests that, while cash may serve a purpose for liquidity or short-term needs, it often falls short when it comes to long-term wealth growth.
- A Look at the Data: The below chart demonstrates the hypothetical growth of $100 adjusted for inflation, comparing cash held “under the mattress” earning no interest and being eroded by the impacts of inflation to its theoretical growth over the same time-period in the S&P 500. Adjusted for inflation, $100 in the S&P 500 since 1950 (as of April 2, 2025), has grown to $2,475, while $100 under the mattress has fallen to $7 in purchasing power today.
- Investing Implications: For investors, the data reinforces the importance of putting money to work in growth-oriented assets, such as equities, to combat inflation and build wealth. Holding cash may seem prudent in uncertain times, but over the long term, it’s unlikely to generate the same growth potential as a diversified investment strategy focused on assets like the S&P 500. Diversifying and staying invested can help protect purchasing power and generate significant returns over time.
In Conclusion
It may feel like the sky is falling in the moment, but history shows that investors who stay the course are typically rewarded. If recent volatility has you feeling uneasy, this could be a good time to revisit your risk tolerance and financial plan. For those contributing to retirement accounts or holding cash on the sidelines, these pullbacks can also present compelling buying opportunities.