Navigating Market Volatility: Insights & Strategies
Imagine a 5-year period where we experienced these successive market corrections:

  • Year 1: -34%

  • Year 2: -5%

  • Year 3: -25%

  • Year 4: -10%

  • Year 5: -9%

Would you be surprised to know that we have experienced these market conditions over the last five years, and except for 2022, annual returns were far from negative. In fact, during this time, markets averaged double-digit annual returns.

This serves as a powerful reminder that volatility is part of the journey. Market declines are uncomfortable, but they are necessary and temporary. Do you remember how you felt during the COVID correction of 2020? Were you saying, “GET ME OUT!” or “What should we buy?”

Anything that can be up dramatically in a day, month, or year has the potential to be down over a similar period. Friends and clients routinely ask me, “What is this market going to do this year?” My answer: “I have no idea.” That said, since the advent of public investment markets in the early 1600’s, they have created extraordinary compound returns over long periods of time.

Our biggest obstacle to long-term investment success is our own DNA. Our fight-or-flight response is a well-documented reaction that has contributed to our survival as a species. It most certainly helped our ancestors survive saber-toothed tigers and dire wolves. Unfortunately, that same instinct works against us in investing. When markets fall, our instincts scream “RUN,” and at market highs, they whisper “I want more.” We desperately want to buy high and sell low.

Think about this… what causes a stock’s price to go up or down? Corporate profits, the Federal Reserve, China, tariffs, oil prices, unemployment numbers, and retail sales are all factors that can affect stock prices and markets. These headlines often influence fear and greed, but the fundamental question is always the same for any item purchased or sold: Are there more buyers (demand) or more sellers (supply)?

Stocks and markets reach highs—only identifiable after the fact—when demand is highest and supply is lowest. More people want to buy (increasing demand) while fewer people want to sell (less supply). This is driven by the same euphoric emotion: “It’s going higher, I want to buy more,” and “It’s going higher, I don’t want to sell now.”

At this point, the market is saturated with buyers, volume drops, and any bad news that creates a sudden increase in sellers causes prices to fall. Now, we have more sellers (supply) and fewer buyers (demand).

This scenario often corrects itself quickly—that is the nature of an open market—but occasionally fear and panic drive prices to surprising lows. At that point, our amygdala (the brain’s emotional center) sends a distress signal to the hypothalamus, activating the HPA axis (Hypothalamic-Pituitary-Adrenal axis). This triggers the release of cortisol (the stress hormone), which, along with a surge of adrenaline, heightens senses and our internal controls are screaming, “RUN!”

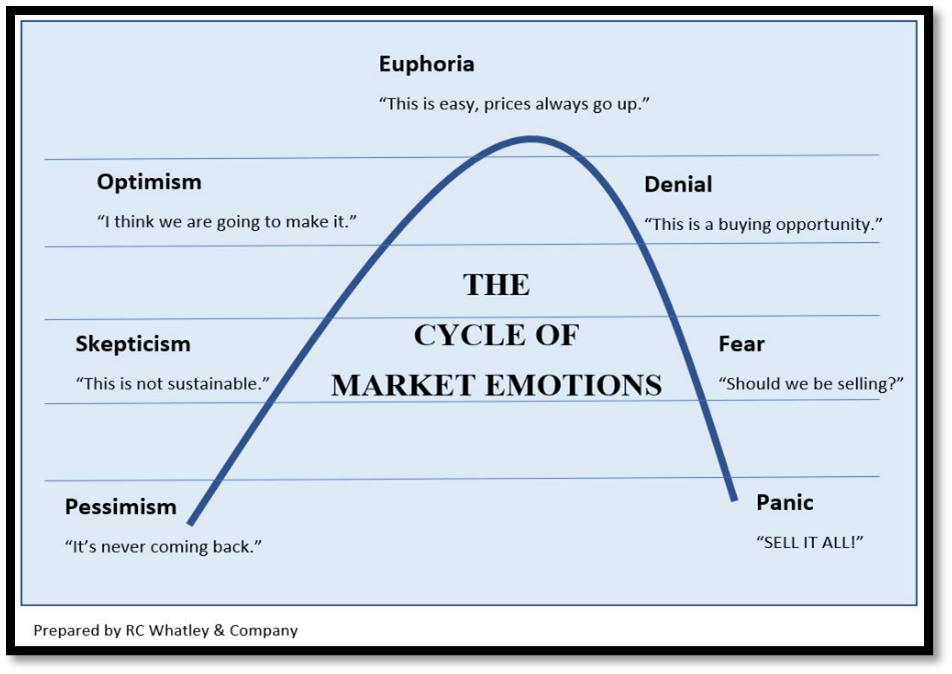
All this creates a scenario where we want more risk at market highs and no risk at market lows. I keep the “Cycle of Market Emotions” chart on my desk as a reminder to eliminate emotions from our investment process. It illustrates how euphoria often precedes major corrections, while panic and fear mark opportunities for those who remain disciplined.